
Stop Building Spreadsheets.
Start Building Visual Systems.
The Problem
You Didn’t Get Into Performance To Live In Excel
Most practitioners are stuck:
Copy-pasting data every week
Rebuilding the same graphs over and over
Struggling to communicate insights clearly
And the result?
More time managing data than actually using it
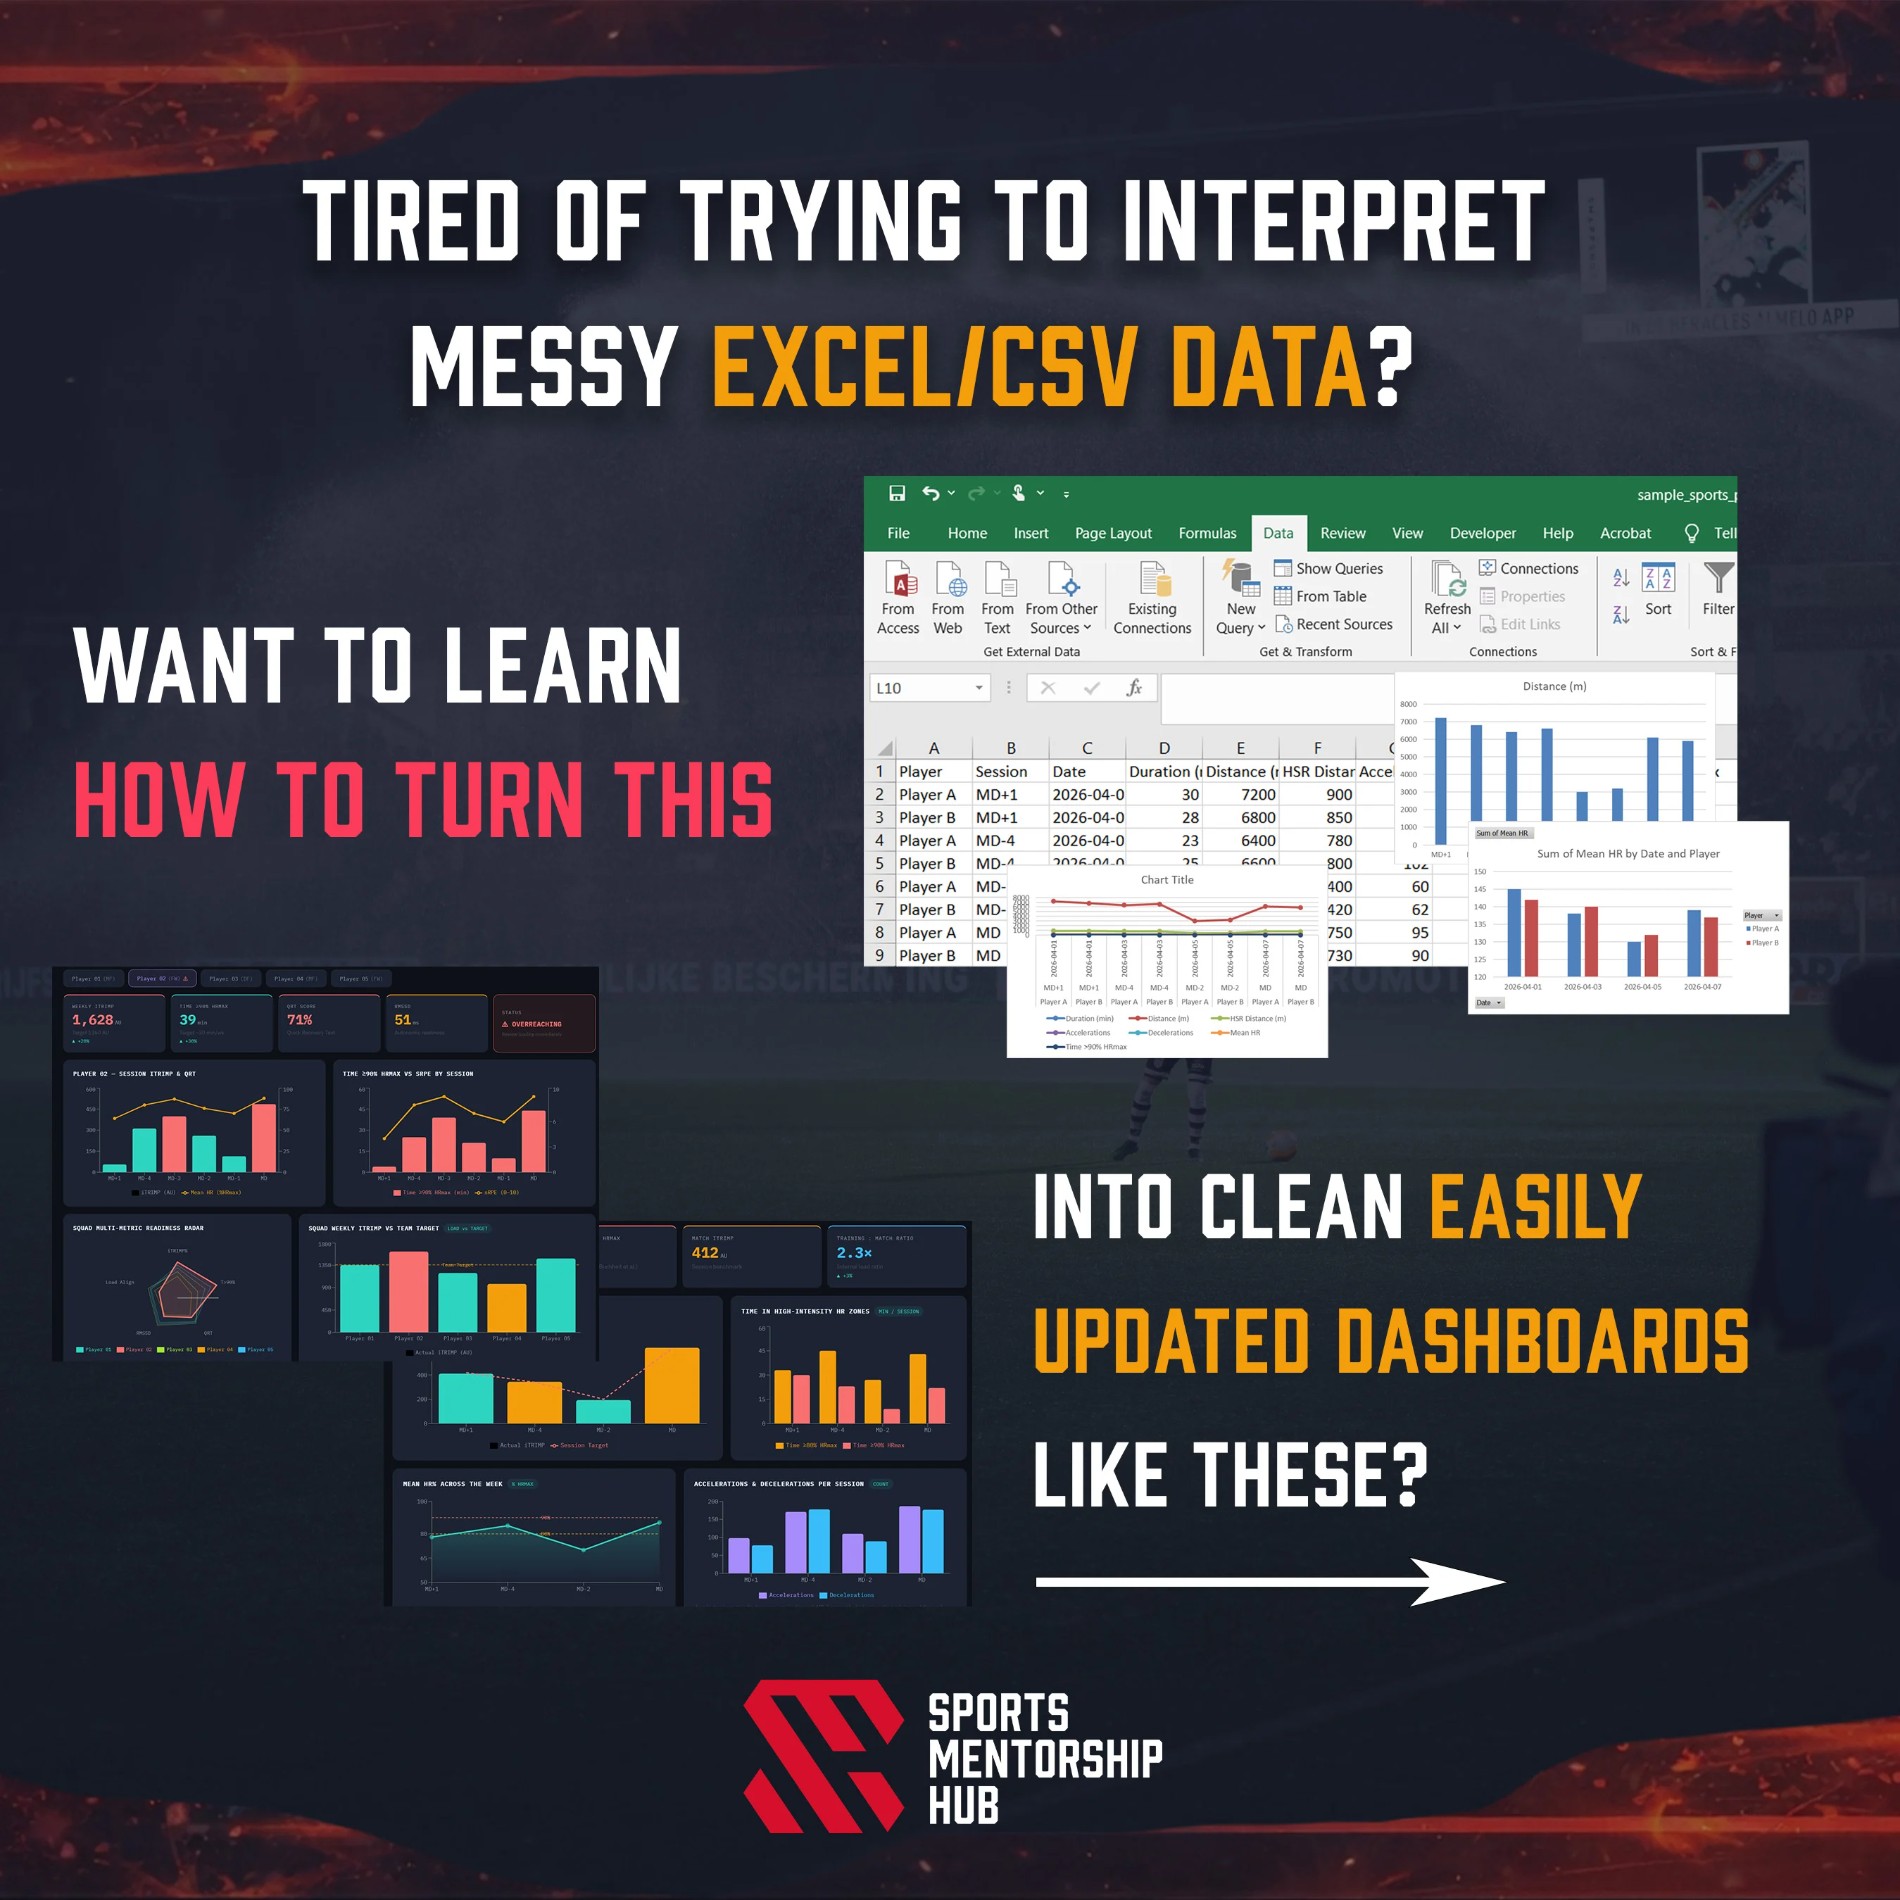
The Solution
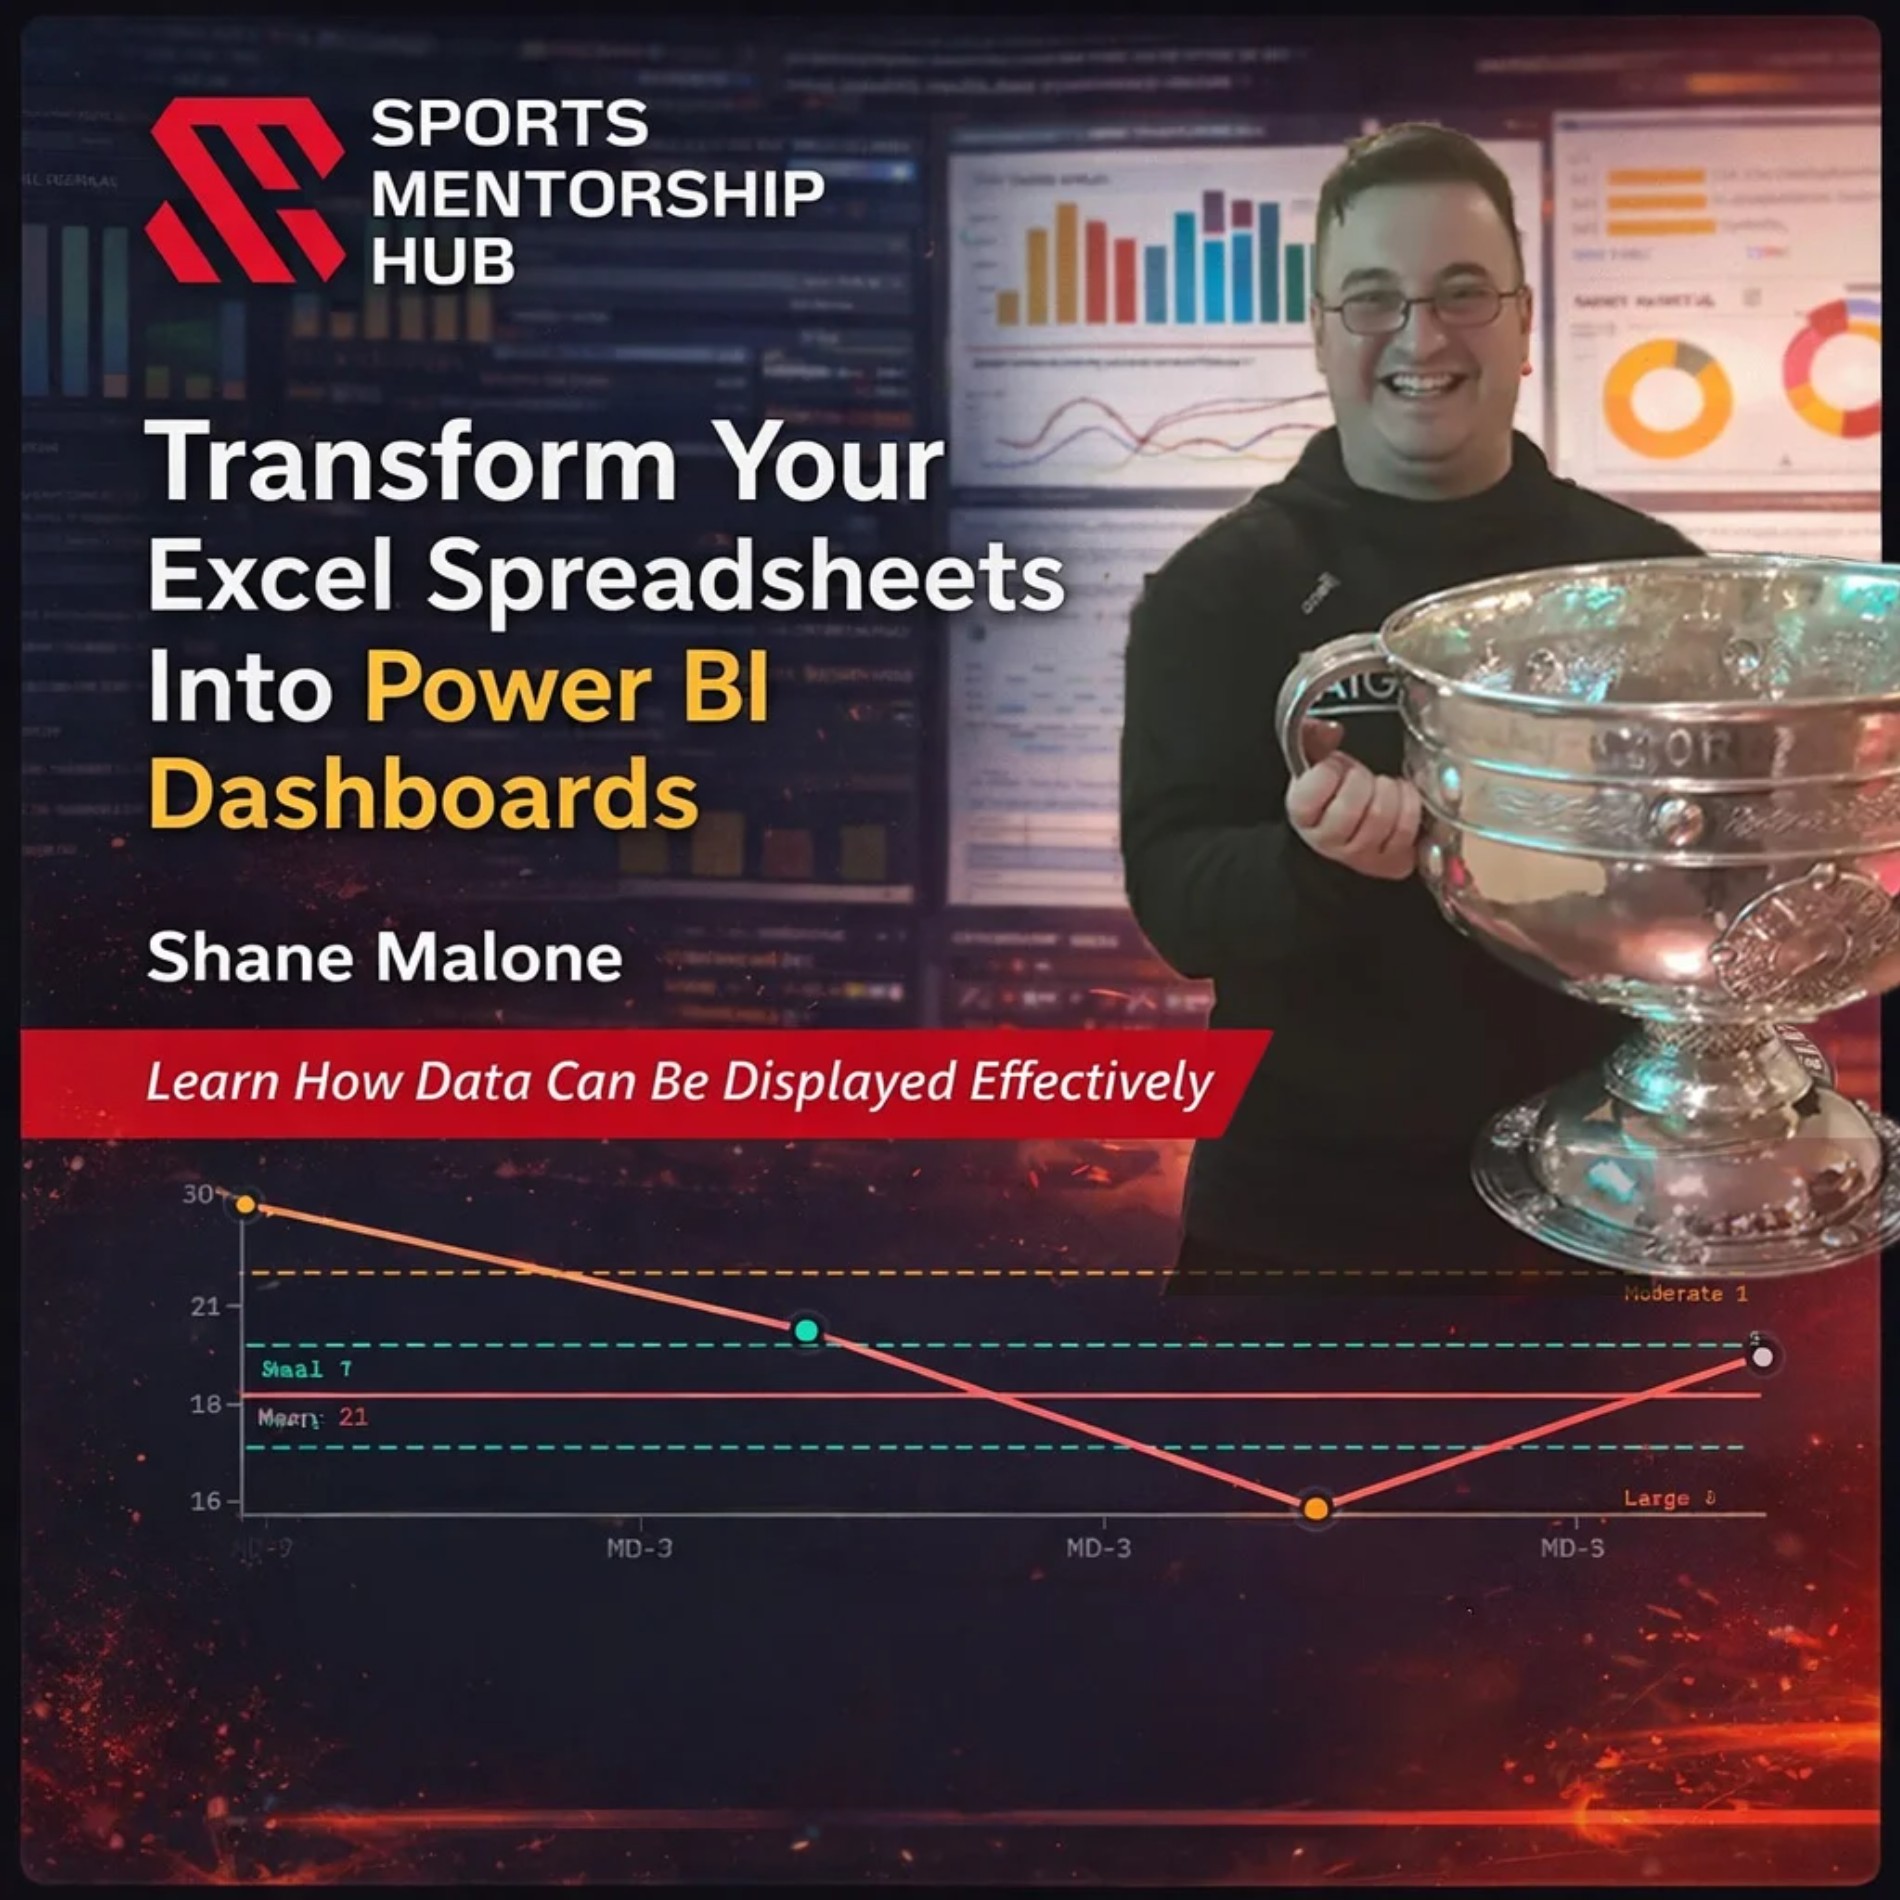
Introducing: The Power BI Clinic
A 10-week, cohort-based programme designed to help you build real dashboards using your own data.
This isn’t theory.
You’ll work directly on your own performance exports and leave with:
A fully functioning dashboard
A repeatable data workflow
A system you can use every week
The Clinic: Ten Weeks, A Primer for Your Data, That Leads to Real Dashboards
Sports Mentorship Hub in conjunction with Shane Malone PhD have developed a Power BI clinic that is a practical, cohort-based programme for performance practitioners who are ready to stop copy-pasting and start building infrastructure. It runs over 5 months (2 sessions per month), with small group sizes to keep feedback personal and sessions applied from day one. Bring your own performance-based CSV data export to life via a working report and through working examples of real life problems.
Clean data-pipeline from your own exports
% change, SWC flags, conditional formatting rules
Build out dashboards that have real world impact in your environment using visuals from Power BI, that allows you to action outcomes that have impact on your training process
Scheduled refresh, mobile view, sharing permissions
Vibe coding out new user friendly and visually friendly - HTML visuals via HTML Lite
This Programme Is Built For You If:
You work in sports performance / sports science
You’re currently using Excel or basic reporting tools
You want to improve how you present and use data
You’re ready to move from manual work → automated systems
✅Practical
on-field applications
✅Peer learning in
a small-group format
✅Evidence-based frameworks
✅Live discussions & case reviews
✅Real Dashboards you can use from Day one
Stop Managing Data. Start Using It.
If you’re ready to build dashboards that actually impact decisions…
Register for the waiting list now!
We keep numbers small to ensure quality feedback and real progress.
Once spots are filled, registration closes.
Three things you'll actually use from day one.
Understand how to build a dashboard your coach can open on their phone or laptop
You'll learn how to wrangle data and build a live GPS report that updates itself every morning. No more sending screenshots. No more "I'll get that to you later." Your coaching staff open a link and the data is already there, who trained hard this week, who spiked their load, who needs a conversation before the next session. Moving beyond averages towards Z-score bounds and Smallest Worthwhile Changes.
Learn how to bring together readiness data from force-time measures and build a reporting system that tells you how meaningful a change actually is
Not just a red flag. A report that tells you whether a drop in performance is a blip or something worth acting on, using the Smallest Worthwhile Change of the measure, calibrated to your own squad. You'll be able to walk into a medical meeting and explain exactly why an athlete is being flagged, and back it up.
Build a data pipeline that does the admin for you
Drop the session file in a folder. The report updates. That's it. The hour you used to spend copying data into spreadsheets after every session disappears. It works the same whether you have four athletes or forty.
Everything is built on data you'll use daily, from your system, for your squad. You're not practising on made-up numbers. You're building something real that you'll use week to week from the moment the course starts
© 2024 Your Company, Inc. All rights reserved.